|
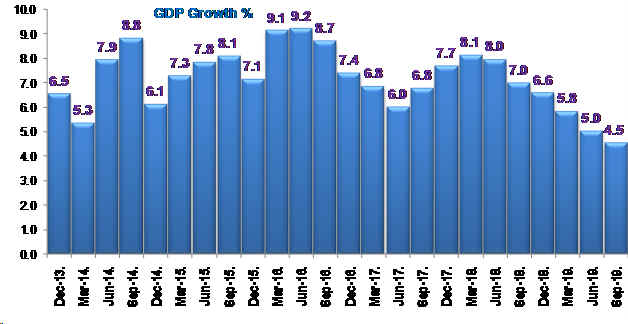
India's gross domestic product (GDP) growth moderated to 26-quarters low of 4.5% in Q2 of 2019-20 from 5.0% growth recorded in the previous quarter and 7.0% improvement in the corresponding quarter last year. Quarterly Gross Value Added (GVA) growth also eased to 4.3% in Q2 of 2019-20 from 4.9% in Q2 of 2019-20 and 6.9% in Q2 of 2018-19.
The GDP growth moderation has been mainly driven by sharp deceleration in the GDP growth emanating from the industrial sector at 0.5% in Q2 of 2019-20 from 6.7% growth in Q2 of 2018-19, while services sector growth has eased to 6.8% from 7.3%. Further, the agriculture sector growth also eased to 2.1% in Q2 of 2019-20 from 4.9% growth in Q2 of 2018-19.
Within the industrial sector, the mining sector growth remained weak to 0.1% against 2.2% decline in Q2 of 2018-19, while the utilities sector growth also eased to 3.6% from 8.7%. Further, the growth for construction sector moderated to 3.3% from 8.5%, while the manufacturing sector growth turned negative at (-) 1.0% from 6.9%.
The services sector growth eased to 6.8% led by slow growth in the financial, real estate and professional services of 5.8% from 7.0% and trade, hotel, transport and communication have moderated to 4.8% from 6.9%. However, the growth public services improved to 11.6% in Q2 of 2019-20.
Agriculture GDP growth eases
Quarterly GVA at Basic Prices for Q2 2019-20 from ‘Agriculture, Forestry and Fishing' sector grew by 2.1% as compared to growth of 4.9% in Q2 2018-19. The crops including fruits and vegetables account for about 43%, the livestock products 39% and forestry& fisheries 18% share of GVA in total GVA of ‘Agriculture, Forestry and Fishing' sector.
According to the information furnished by the Department of Agriculture, Cooperation & Farmer Welfare (DAC& FW), which has been used in compiling the estimate of GVA from agriculture in Q2 of 2019-20, the production of kharif food grains is estimated to decline 0.8% to 140.57 million tonnes (mt) during 2019-20. However, Oilseeds output is estimated to jump 5.2% to 22.39 mt, cotton 12.4% to 22.39 million bales of 170 kg each, jute and mesta 1.9% to 9.96 million bales of 180 kg each mt in 2019-20. However, the sugarcane output is estimated to dip 5.6% to 377.77 mt.
Industry growth slows
The ‘Industry' sector growth rose at slower pace of 0.5% in its Gross Value Added (GVA) in Q2 of 2019-20 from 2.7% in Q1 of 2019-20 and 6.7% surge in the corresponding quarter of last year. The manufacturing growth turned negative to (-) 1.0% and construction eased to 3.3% contributing to the overall slowdown in industrial sector growth. The utilities sector growth also moderated to 3.8% and mining 0.1% in Q2 of 2019-20.
Mining and quarrying
Quarterly GVA at Basic Prices for Q2 of 2019-20 from ‘Mining and Quarrying' sector grew by 0.1% as compared to growth of (-) 2.2% in Q2 of 2018-19. The key indicators of Mining sector, namely, production of coal, crude oil and natural gas and IIP mining registered growth rates of (-) 10.3%, (-) 5.1%, (-) 2.6% and (-) 1.2%, during Q2 of 2019-20 as compared to 6.2%, (-) 4.4%, (-) 2.0% and 0.9% respectively, during Q2 of 2018-19.
Manufacturing
Quarterly GVA at Basic Prices for Q of 22019-20 from ‘manufacturing' sector grew by (-) 1.0% as compared to growth of 6.9% in Q2 of 2018-19. The growth of organized sector (which has a share of more than 75% in the Manufacturing sector) was estimated from available data of Listed Companies with BSE and NSE. The Quasi-Corporate and Unorganized segment (which has a share of more than 20% in the Manufacturing sector) has been estimated using IIP of Manufacturing. IIP Manufacturing registered growth rate of (-) 0.4% during Q2 of 2019-20 as compared to 5.6% during Q2 of 2018-19.
Electricity, Gas, water supply and other utility services
Quarterly GVA at Basic Prices for Q2 OF 2019-20 from ‘electricity, gas, water supply and other utility services' sector grew by 3.6% as compared to growth of 8.7% in Q2 of 2018-19. The key indicator of this sector, namely, IIP of electricity registered growth rate of 0.4% during Q2 of 2019-20 as compared to 7.5% in Q2 of 2018-19.
Construction
Quarterly GVA at Basic Prices for Q2 of 2019-20 from ‘construction' sector grew by 3.3% as compared to growth of 8.5% in Q2 of 2018-19. Key indicators of construction sector, namely, production of cement and consumption of finished steel registered growth rates of 0.3% and3.3% respectively, during Q2 of 2019-20 as compared to 12.5%, 9.9% respectively, in Q2 of 2018-19.
Services sector growth improves
The services sector GVA growth eased to 6.8% in Q2 of 2019-20, as compared with 6.9% growth in the previous quarter and 7.3% in Q2 of 2018-19.
Quarterly GVA at Basic Prices for Q2 of 2019-20 from trade, hotels, transport, communication and services related to broadcasting sector grew by 4.8% as compared to growth of 6.9% in Q2 of 2018-19. Key indicator used for estimating GVA from trade sector is the sales tax growth. With introduction of GST, Sales Tax data is now subsumed under GST. Therefore, a comparable estimate of turnover based on Sales Tax has been estimated. Indicator used for measuring GVA from hotels and restaurant sector is the private corporate growth in this sector. Among the other services sectors, cargo handled at major sea ports, cargo handled by the civil aviation and passengers handled by the civil aviation registered growth rates of 1.4%, (-) 8.7% and 1.3% respectively, during July-September, 2019-20. Indicators of railways sector, namely, net tonne kilometers and passenger kilometers have shown growth of (-) 7.0% and (-) 2.0% respectively, during Q2 of 2019-20.
Quarterly GVA at Basic Prices for Q2 of 2019-20 from financial, real estate and professional services sector grew by 5.8% as compared to growth of 7.0% in Q2 of 2018-19. Major component of this industry is the real estate and professional services which has a share of over 75%.The key indicators of this sector are the quarterly growth of corporate sector for real estate, business services and computer related activities which are estimated from available data from listed companies. The other indicators of this sector, viz., aggregate bank deposits, and bank credits have shown growth rates of 9.4% and 8.7% respectively as on 11 November 2019.
Quarterly GVA at Basic Prices for Q2 2019-20 from public administration, defence and other services sector grew by 11.6% as compared to growth of 8.6% in Q2 2018-19. The key indicator of this sector namely, Union Government revenue expenditure net of interest payments excluding subsidies, grew by 33.9% during Q2 of 2019-20 as compared to 22.2% in Q2 of 2018-19.
GDP at current prices
GDP at current prices in q2 of 2019-20 is estimated at Rs 49.64 lakh crore, as against Rs 46.79 lakh crore in Q2 of 2018-19, showing a growth rate of 6.1%. GVA at basic price at current prices is showing an increase of 6.3%. Growth rates in various sectors are as follows: ‘agriculture, forestry and fishing' (7.4%), ‘mining and quarrying' (-4.4%), ‘manufacturing' (-1.1%), ‘electricity, gas, water supply and other utility services' (2.3%), ‘construction' (4.2%), 'trade, hotels, transport and communication' (6.1%), 'financial, real estate and professional services' (6.5%), and ‘public administration, defence and other services' (17.1%).
GDP is derived by adding taxes on products net of subsidies on products to GVA at basic prices. The net indirect collection is showing growth of 7.2% for Q2 of 2019-20 from 6.1% growth in Q1 of 2019-20. The net indirect collection has increased 12.3% in 2018-19 from 13.0% growth in 2017-18.
Price indices used as deflators
The Wholesale Price Index (WPI), in respect of the groups - Food Articles and All Commodities, has registered a growth of 7.3% and 0.9% respectively whereas mining sector, manufactured products and Electricity declined by 4.4%, 0.1% and 1.2% during Q2 of 2019-20 over Q2 of 2018-19. The Consumer Price Index (CPI) has shown a rise of 3.5% during Q2 of 2019-20 as compared to growth of 3.9% during Q2 of 2018-19.
Estimates of final expenditures on GDP
The rates Private Final Consumption Expenditure (PFCE) at current and constant (2011-12) Prices during Q2 of 2019-20 are estimated at 59.3% and 56.3% of GDP, respectively, as against the corresponding rates of 58.3% and 56.1%, respectively in Q2 of 2018-19.
The rates of Government Final Consumption Expenditure (GFCE) at Current and Constant (2011-12) Prices during Q2 of 2019-20 are estimated at 13.9% and 13.1%, respectively, as against the corresponding rates of 12.4% and 11.9%, respectively in Q2 of 2018-19.
The rates of Gross Fixed Capital Formation (GFCF) at Current and Constant (2011-12) Prices during Q2 of 2019-20 are estimated at 27.3% and 30.1%, respectively, as against the corresponding rates of 29.2% and 32.4%, respectively, in Q2 of 2018-19.
Outlook
India's GDP growth moderated sharply to 26-quarters low in Q2 of 2019-20, driven by moderation in agriculture, industrial as well as services sector GDP growth. The Reserve Bank of India (RBI) has reduced real GDP growth estimate for 2019-20 from 5.0% in the December policy review along with subdued growth forecast of 4.9-5.5% for H2 of 2019-20.
|
GDP Growth at Constant (2011-12) Prices |
|
|
Q1 FY18 |
Q2 FY18 |
Q3 FY18 |
Q4 FY18 |
Q1 FY19 |
Q2 FY19 |
Q3 FY19 |
Q4 FY19 |
Q1 FY20 |
Q2 FY20 |
|
I. Agriculture, forestry & fishing |
4.2 |
4.5 |
4.6 |
6.5 |
5.1 |
4.9 |
2.8 |
-0.1 |
2.0 |
2.1 |
|
II. Industry (2+3+4+5) |
0.8 |
6.9 |
8.0 |
8.1 |
9.8 |
6.7 |
7.0 |
4.2 |
2.7 |
0.5 |
|
2. Mining & quarrying |
2.9 |
10.8 |
4.5 |
3.8 |
0.4 |
-2.2 |
1.8 |
4.2 |
2.7 |
0.1 |
|
3. Manufacturing |
-1.7 |
7.1 |
8.6 |
9.5 |
12.1 |
6.9 |
6.4 |
3.1 |
0.6 |
-1.0 |
|
4. Electricity, gas, water supply & utility services |
8.6 |
9.2 |
7.5 |
9.2 |
6.7 |
8.7 |
8.3 |
4.3 |
8.6 |
3.6 |
|
5. Construction |
3.3 |
4.8 |
8.0 |
6.4 |
9.6 |
8.5 |
9.7 |
7.1 |
5.7 |
3.3 |
|
III. Services (6+7+8) |
9.4 |
6.8 |
8.0 |
8.2 |
7.1 |
7.3 |
7.2 |
8.4 |
6.9 |
6.8 |
|
6. Trade, hotels, transport, communication and services related to broadcasting |
8.3 |
8.3 |
8.3 |
6.4 |
7.8 |
6.9 |
6.9 |
6.0 |
7.1 |
4.8 |
|
7. Financial, real estate & professional services |
7.8 |
4.8 |
6.8 |
5.5 |
6.5 |
7.0 |
7.2 |
9.5 |
5.9 |
5.8 |
|
8. Public administration, defence & Services |
14.8 |
8.8 |
9.2 |
15.2 |
7.5 |
8.6 |
7.5 |
10.7 |
8.5 |
11.6 |
|
GVA at Basic Price |
5.9 |
6.6 |
7.3 |
7.9 |
7.7 |
6.9 |
6.3 |
5.7 |
4.9 |
4.3 |
|
GDP at Market prices |
6.0 |
6.8 |
7.7 |
8.1 |
8.0 |
7.0 |
6.6 |
5.8 |
5.0 |
4.5 |
|
Source: Central Statistics Office |
|