|
India' WPI inflation dipped to 31 months low of 6.87% in July 2012, sharply beating market expectations of increase in inflation to 7.4% from 7.25% in June 2012. Capital Market had conducted the poll amongst economists for their projections of inflation figure for July 2012. As per the results of poll, the rate of inflation for July 2012 was expected to increase to 7.4% from 7.25% during June 2012. Economists polled had forecasted the inflation in the range of 7.1% to 7.2% for July 2012. The median of the economists forecast's for inflation of July 2012 stood at 7.4%, while the average was lower at 7.3%.
The inflation figure for July 2012 was driven down by fall in inflation for vegetables, gaur seed, crude petroleum, mineral oils, basic metals etc. Meanwhile, the inflation for food grains, fruits, spices, raw cotton, oilseeds, textiles item etc increased during July 2012.
The inflation for primary articles eased slightly from 10.46% in June to 10.39% in July 2012. The inflation for fuel and power group has consistently moderated from three years high of 17.0% in January 2012 to 12.8% in March 2012, 11.53% in May 2012 and further dipped to more than two and half years low of 6.0% in July 2012. Meanwhile, the inflation for manufactured products increased to 5.6% in July, after remaining steady for the last four sequential months.
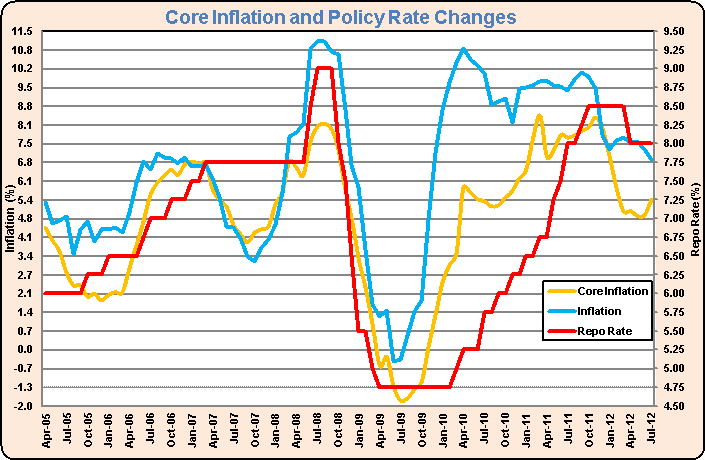
The inflation for food item (food articles and food products) declined to 8.72% in July from 9.03% in June 2012, which has jumped from mere 1.5% in January 2012. Meanwhile, the inflation for non-food items (all commodities excluding food items) eased to 6.20% in July 2012 from 6.59% in June 2012. The core inflation (manufactured products excluding foods products) rebounded to 5.45% in July 2012 to 4.89% in June 2012, which remained nearly steady for previous four sequential months.
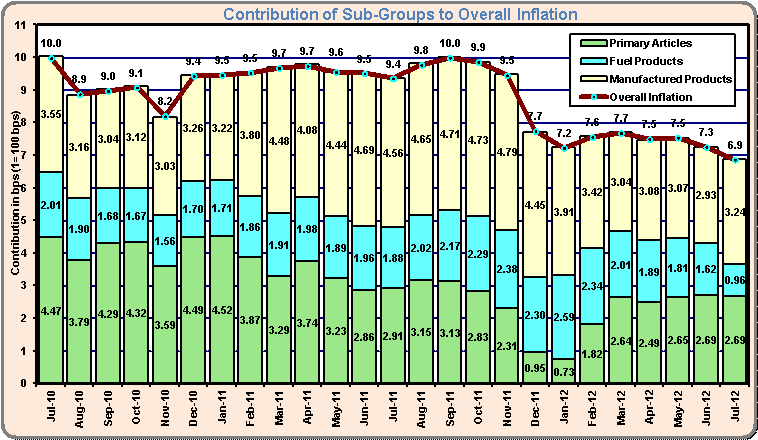
The contribution of primary articles to the overall inflation rose from 37.2% (at 269 bps to 7.25% inflation) in June 2012 to 39.0% (at 269 bps of 6.87%) in July 2012. The contribution of fuel product group dipped from 22.3% (162 bps) in June 2012 to 13.9% (96 bps), while that of manufactured products surged 6.6% to 47.1% (324 bps) in July 2012. The contribution of food item (food articles and food products) increased from 34.1% (247 bps) in June 2012 to 35% (241 bps) in July 2012, while that of non-food items (all commodities excluding food items) eased from 66.1% (479 bps) in June 2012 to 65.1% (449 bps) in July 2012.
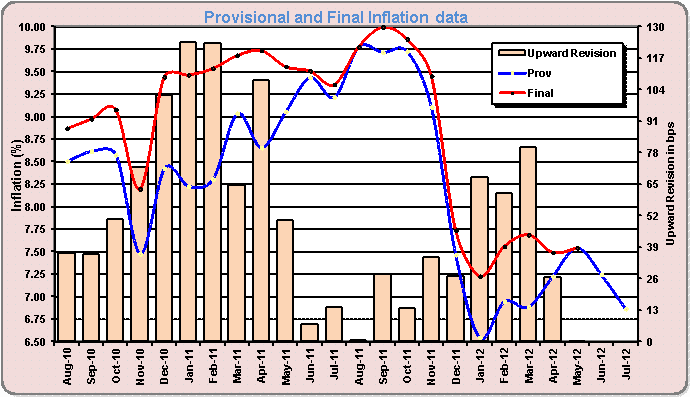
Provisional data left unchanged for second time in last 21 months
The Ministry of Commerce has retained the provisional inflation figure for May 2012 unchanged at 7.55%, same as reported in June 2012. The Ministry started releasing the WPI data for 2004-05 base year from August 2010, since then it was continuously revising provisional figures upward except the figures for August 2011 and now for May 2012.
The inflation figure of fuel and power group for May 2012 was maintained steady at 11.53%, while that for manufactured products was raised to 5.24% from 5.02% reported earlier. However, the inflation for primary article was revised downwards to 10.31% from provisional figure of 10.88% reported earlier.
Inflation for Sub-Groups
The decline in the inflation for primary articles was mainly driven by food articles inflation easing to 10.06% in July 2012 from 10.81% in June 2012, while inflation for mineral also dipped to 8.43% in July 2012 from 14.49% in June 2012. However, the inflation for non-food articles doubled to 13.05% in July 2012 from 6.85% in June 2012.
Within food articles group, under primary articles group, the inflation for vegetables halved from 48.8% in June to 24.11% in July 2012, while the inflation for fish-inland and poultry chicken eased to 31.2% and 14.9% in July 2012. On the other hand, the inflation for fruits increased to (-) 0.2% in July 2012. The inflation for food grains further increased to 12.0%, while that for milk increased to 8.0% from 7.3% in June 2012. Further, the inflation for spice increased to (-) 14.2%, while that for fish-marine, black pepper and coffee rose to 12.9%, 49.4% and (-) 6.9% in July 2012.
Within the vegetables, the inflation for brinjal and cabbage dipped to 1.2% and 92.6%, while that for tapioca and onion declined to (-) 25.72% and (-) 9.8% in July 2012. Among the fruits, inflation for papaya, lemon, banana and orange surged, while that for litchi and mango declined. Among the food grains, the inflation for rice, gram, urad and arhar increased to 10.1%, 63.5%, (-) 7.4% and 10.0%, while that for jowar declined to (-) 11.6% during July 2012.
The inflation for non-food articles, in primary articles group, doubled from 6.8% in June 2012 to 13.1% in July 2012, driven down by surge in inflation for raw cotton to 4.7% in July from (-) 15.6% in July 2012. The inflation for oilseeds also surged to 25.2%, as the inflation for soyabean zoomed to 79.1% during July 2012. Further, the inflation for flowers also increased to (-) 3.8% from (-) 13.1% in June 2012. However, the inflation for gaur seed further dipped to 154.7% in July from 322.8% in July 2012.
The inflation for minerals group, under primary articles group, dipped from 14.5% in June 2012 to 8.43% in July 2012 driven down by sharp dip in inflation for crude petroleum to 7.64% in July 2012, while the inflation for copper ore also declined to 7.4% in July 2012. Within the minerals group, the inflation for iron ore increased from 9.4% in June 2012 to 10.5% in July 2012.
The inflation for fuel and power group halved from 10.27% in June 2012 to 5.98% in July 2012. Within the group, the inflation for coal and electricity was steady at 13.9% and 4.0%. Meanwhile, the inflation for mineral oil slumped to 4.53% in July from 10.9% in June 2012. Among the mineral oils, the inflation for high speed diesel, kerosene, LPG, petrol, naphtha and furnace oil declined to 0.0%, 0.0%, 0.7%, 8.6% and 10.8% during July 2012.
Within Manufactured group, the inflation for food products increased to 6.25% in July 2012, while that for transport equipment and chemical products also increased to 3.5% and 7.23% in July 2012. Further, the inflation for non-metallic mineral products and machinery & machine tools also rose to 8.12% and 3.0% in July 2012. Further, the inflation for textiles increased sharply to 0.9% led by increase in inflation for cotton textiles (from -5.8% to 0.6%), man made textiles (0.7% to 1.3%). However, the inflation for rubber & plastic products and base metals eased to 1.95% and 9.62% in July 2012.
| Index Numbers of Wholesale Prices (Base 2004-05=100) |
|
Weight (%) |
Inflation |
Contribution to Inflation |
| Jul-11 |
Jul-12 |
April-July |
Jul-11 |
Jul-12 |
April-July |
| 2011-12 |
2012-13 |
2011-12 |
2012-13 |
| All Commodities |
100.00 |
9.36 |
6.87 |
9.54 |
7.29 |
9.36 |
6.87 |
9.54 |
7.29 |
| I Primary Articles |
20.12 |
11.47 |
10.39 |
12.68 |
10.18 |
2.91 |
2.69 |
3.18 |
2.63 |
| (A) Food Articles |
14.34 |
8.19 |
10.06 |
8.67 |
10.60 |
1.48 |
1.80 |
1.55 |
1.87 |
| (B) Non-Food Articles |
4.26 |
15.77 |
13.05 |
20.61 |
7.34 |
0.72 |
0.64 |
0.95 |
0.37 |
| (C) Minerals |
1.52 |
25.84 |
8.43 |
25.57 |
12.56 |
0.69 |
0.26 |
0.68 |
0.38 |
| II Fuel & Power |
14.91 |
12.04 |
5.98 |
12.56 |
9.94 |
1.88 |
0.96 |
1.93 |
1.57 |
| (A) Coal |
2.09 |
13.25 |
13.92 |
13.25 |
13.92 |
0.32 |
0.35 |
0.32 |
0.35 |
| (B) Mineral Oils |
9.36 |
15.36 |
4.53 |
15.87 |
10.38 |
1.60 |
0.50 |
1.61 |
1.11 |
| (C) Electricity |
3.45 |
-1.32 |
4.00 |
-0.13 |
4.00 |
-0.04 |
0.10 |
0.00 |
0.10 |
| III Manufactured Products |
64.97 |
7.73 |
5.58 |
7.47 |
5.27 |
4.56 |
3.24 |
4.44 |
3.08 |
| (A) Food Products |
9.97 |
8.13 |
6.25 |
7.67 |
6.05 |
0.80 |
0.61 |
0.76 |
0.59 |
| (B) Beverages & Tobacco Products |
1.76 |
12.60 |
6.06 |
10.66 |
7.34 |
0.23 |
0.11 |
0.19 |
0.13 |
| (C ) Textiles |
7.33 |
11.41 |
0.93 |
14.68 |
-1.89 |
0.69 |
0.06 |
0.89 |
-0.12 |
| (D) Wood & Wood Products |
0.59 |
9.61 |
4.45 |
6.80 |
5.94 |
0.06 |
0.03 |
0.04 |
0.04 |
| (E) Paper & Paper Products |
2.03 |
6.40 |
2.44 |
7.23 |
2.25 |
0.11 |
0.04 |
0.13 |
0.04 |
| (F) Leather & Leather Products |
0.84 |
1.01 |
2.85 |
0.37 |
3.52 |
0.01 |
0.02 |
0.00 |
0.02 |
| (G) Rubber & Plastic Products |
2.99 |
7.76 |
1.95 |
8.36 |
1.88 |
0.20 |
0.05 |
0.22 |
0.05 |
| (H) Chemicals & Chemical Products |
12.02 |
8.68 |
7.23 |
7.76 |
7.13 |
0.90 |
0.75 |
0.82 |
0.74 |
| (I ) Non-Metallic Mineral Products |
2.56 |
3.51 |
8.12 |
3.81 |
7.14 |
0.09 |
0.20 |
0.10 |
0.18 |
| (J) Basic Metals, Alloys & Metal Products |
10.75 |
10.64 |
9.62 |
9.00 |
10.30 |
1.11 |
1.02 |
0.96 |
1.09 |
| (K) Machinery & Machine Tools |
8.93 |
3.07 |
2.98 |
2.99 |
2.48 |
0.23 |
0.21 |
0.23 |
0.18 |
| (L) Transport, Equipment & Parts |
5.21 |
3.16 |
3.46 |
2.41 |
3.66 |
0.14 |
0.15 |
0.11 |
0.15 |
| Non-Food Manufactured |
55.00 |
7.69 |
5.45 |
7.43 |
5.14 |
3.78 |
2.64 |
3.69 |
2.50 |
| Food Articles + Food Products |
24.31 |
8.17 |
8.72 |
8.31 |
8.99 |
2.28 |
2.41 |
2.30 |
2.46 |
| Non-Food Inflation |
75.69 |
9.82 |
6.20 |
10.03 |
6.65 |
7.07 |
4.49 |
7.25 |
4.83 |
| Source: Ministry of Commerce and Industry |
Contribution to inflation
During June 2012, WPI based inflation rate stood at 6.87%, of that 39.0% came from primary articles, followed by 47.1% from the manufactured products group and 13.9% from fuel products group. WPI based inflation for July 2012 was 38 bps lower compared to 7.25% reading in June 2012.
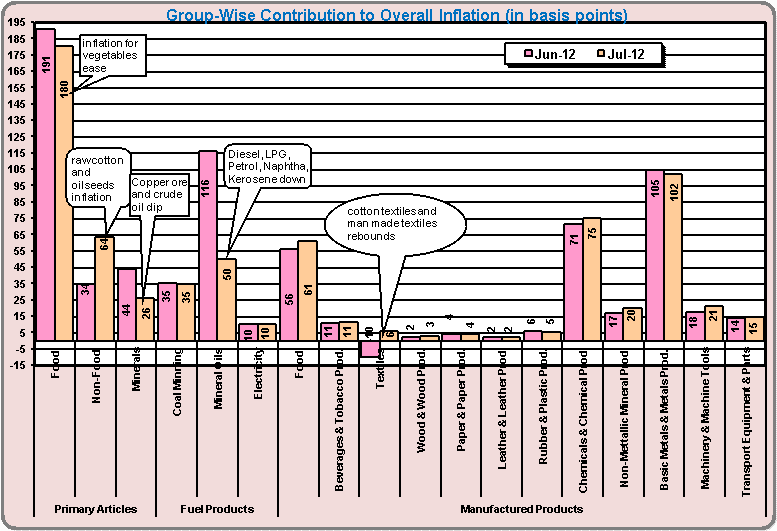
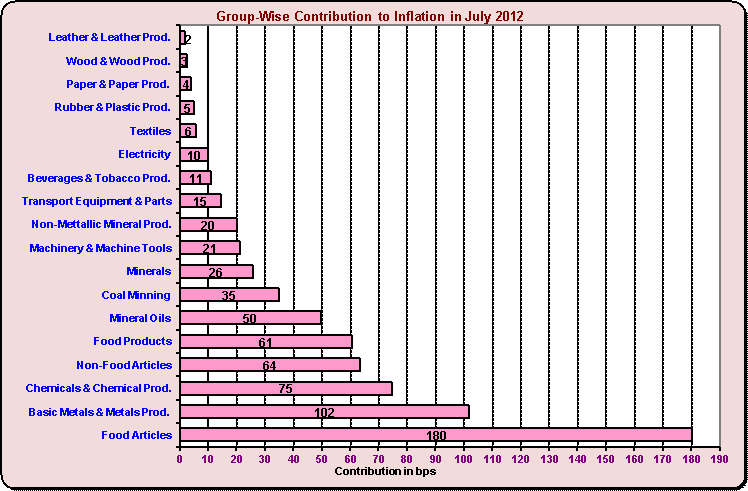
Within the primary articles, the contribution of food articles to overall inflation declined from 191 bps in June 2012 to 180 bps during July 2012. Within the food articles, the contribution of fruits, cereals, pulses, milk and spices increased, while that of vegetables and fish-inland and poultry chicken declined during July 2012. The contribution of non-food articles nearly doubled from 34 bps in June 2012 to 64 bps in July 2012. Among the non-food articles, the contribution of raw cotton, oilseeds and flowers surged, while that of gaur seed dipped during July 2012. The contribution of mineral group increased dipped from 44 bps in June 2012 to 26 bps in July 2012, due to slump in inflation for copper ore and crude petroleum during July 2012.
The contribution of fuel and power group dipped to 96 bps from 162 bps during June 2012. Within the fuel products group, the contribution of mineral oils slumped more than halved to 50 bps in July 2012 from 116 bps in June 2012. Meanwhile, the contribution of coal and electricity was steady at 35 bps 10 bps during May 2012. Within the mineral oils group, the contribution of high speed diesel, furnace oil, kerosene, LPG and petrol eased during July 2012.
The contribution of manufactured products to overall inflation increased to 324 bps in July from 293 bps June 2012. Within manufactured products, the contribution of ‘food products' increased 05 basis points, while that of textiles and machine tools also increased 16 bps and 04 bps. The contribution of chemical products and non-metallic mineral products rose 03 bps each. On the other hand, the contribution of base metals and rubber products declined 03 bps and 01 bps in July 2012.
As per the commodity wise look-up, The contribution of high speed diesel and crude petroleum dipped by 33 bps and 17 bps, while that of brinjal and cabbage also dipped by 14 bps each during July 2012 from June 2012 level. The contribution of gaur seed, kerosene, LPG and petrol declined 10 bps, 09 bps, 08 bps and 06 bps, respectively. Meanwhile, the share of naphtha, furnace oil and fish inland declined 05 bps each and that of steel casting and copper ore declined 03 bps each. Further, the contribution of poultry chicken, processed prawn, tapioca, groundnut, non-cyclic compound, light diesel oil declined 02 bps each in July 2012.
The contribution of raw cotton surged 21 bps, while that of cotton yarn and soyabean increased 10 bps each during July 2012 from June 2012 level. The share of fish-marine rose 06 bps, while that of rice and di ammonium phosphate moved up 05 bps each in July 2012. The contribution of gram, milk, cotton yarn (bleached), papaya, other oil cakes, grey cement increased 03 bps each, while that of arhar, vanaspati, urad, raw jute, electric generators, orange, sugar, bitumen, lemon, banana rose 02 bps each during July 2012.
Out of the 676 commodities, about 246 commodities, which carry 44.33% weight in the WPI, has recorded deceleration in inflation rate during July 2012 compared with June 2012 inflation rate. About 430 commodities that hold 44.26% weight in the WPI have witnessed acceleration in inflation rate during July 2012. However, the inflation for 120 commodities, carrying 11.42% weight in WPI, has remained unchanged during July 2012.
WPI Inflation (M-o-M Basis)
Primary Articles (Weight 20.12%)
The index for primary articles group rose 1.1% during July 2012 from June 2012 level. Within the group, the index for `Food Articles` group increased 1.4% due to higher prices of gram (10%), arhar (8%), bajra (7%), moong (6%), ragi (5%), urad and fish-marine (5% each), coffee and condiments & spices (4% each), masur and rice (3% each), egg, maize and milk (2% each) and fish-inland, barley and wheat (1% each). However, the prices of poultry chicken (5%), tea (4 %), jowar (2%) and fruits & vegetables (1%) declined.
The index for 'Non-Food Articles' group rose by 2.9% due to higher prices of soyabean (18%), castor seed (13%), gingelly seed (12%), raw cotton and raw jute (9% each), mesta (7%), cotton seed (6%), rape & mustard seed and raw silk (4% each), linseed, flowers and fodder (3 % each), coir fibre and copra (2% each) and sugarcane (1%). However, the prices of gaur seed (27%), raw rubber (3 %), sunflower (2%) and groundnut seed and niger seed (1% each) declined.
The index for 'Minerals' group declined 3.4% due to lower prices of crude petroleum (8%), zinc concentrate and chromite (2% each). However, the prices of phosphorite (40%), magnesite (14%), copper ore (5%), manganese ore, barytes and iron ore (2% each) and steatite (1%) moved up.
Fuel & Power (Weight 14.91%)
The index for this major group declined by 1.5% due to lower prices of light diesel oil (10%), furance oil (8%), naphtha (7%), aviation turbine fuel (ATF) and petrol (4% each).
Manufactured Products (Weight 64.97%)
The index for manufactured products group increased 0.6% during July 2012 from the previous month level. Within the manufactured products group, the index for ‘Food Products' group rose by 1.5% due to higher prices of oil cakes (9%), tea dust (unblended) (5%), sugar, gingelly oil, gur and sunflower oil (3% each), khandsari, soyabean oil, powder milk and mustard & rapeseed oil (2% each) and cotton seed oil, groundnut oil and bakery products (1% each). However, the prices of processed prawn (8%), tea dust (blended) and mixed spices (3% each), coffee powder and palm oil (2% each) and copra oil (1%) declined.
The index for `Beverages, Tobacco & Tobacco Products` group rose by 0.2% due to higher prices of dried tobacco (4%).
The index for `Wood & Wood Products` group rose by 1.4% due to higher prices of plywood & fibre board (2%) and timber / wooden planks and processed wood (1% each).
The index for `Paper & Paper Products` group rose by 0.1% due to higher prices of computer stationery (2%) and kraft paper & bags and laminated paper (1 % each). However, the prices of card board (2%) and paper rolls and paper cartons / boxes (1% each) declined.
The index for ‘Leather & Leather Products` group rose by 0.5% due to higher prices of leather footwear (1%). However, the prices of leather garments & jackets (1%) declined.
The index for `Rubber & Plastic Products` group rose by 0.1% due to higher prices of v belt (5%) and plastic/pvc suitcases and expandable polystyrene (2% each).
The index for `Chemicals & Chemical Products` group rose by 0.7% due to higher prices of di ammonium phosphate (9%), photographic goods (4 %), paints (3%), pesticides, toilet soap and rubber chemicals (2% each) and pigment & pigment intermediates, turpentine oil, washing soap, hair / body oils, polymers, shampoo, basic inorganic chemicals, organic manure and ammonium sulphate (1% each). However, the prices of synthetic resin (7%), non-cyclic compound (3%), distemper (2%) and safety matches/ match box (1%) declined.
The index for `Non-Metallic Mineral Products` group rose by 1.6% due to higher prices of grey cement (3%), glass bottles & bottleware (2%) and bricks & tiles (1%). However, the prices of marbles (2%) and lime (1%) declined.
The index for `Machinery & Machine Tools` group rose by 0.7% due to higher prices of hydraulic equipment (9%), electric generators (6%), electric motors (5%), pvc insulated cable, textile machinery, machine tools, capacitors and electric motor starters (2 % each) and electric switches, thresher, electrical wires, chemical plant equipments, material handling equipments and plastic machinery (1% each). However, the prices of ups / stabilizer (2%) and fibre optic cable, electric switch gears, fluorescent tubes, ball/roller bearing and electronic pcb /micro circuit (1% each) declined.
The index for `Transport, Equipment & Parts` group rose by 0.5% due to higher prices of shafts (all kinds) and railway axle & wheel (2% each) and motor vehicles, auto parts and bi-cycles (1% each).
Expert Views
Sonal Varma, India Economist, Nomura Financial Advisory Services
WPI inflation eased more than expected to 6.87% y-o-y in July from 7.25% in June (Consensus: 7.2%, Nomura: 7.5%). The positive surprise was led by a much lower-than-expected increase in primary inflation (mainly food and minerals prices) even as core inflation jumped sharply.
Core inflation (WPI manufactured ex-food) rose to 5.4% y-o-y in July from 4.8% in June. Higher global commodity prices and the lagged effect of INR depreciation are the main causes, in our view. Meanwhile, food inflation eased to 8.7% y-o-y from 9.0% as prices of vegetables contracted, contrary to our expectations for a sharp uptick. Excluding volatile vegetable prices, food prices continued to rise.
In our view, the current primary (food and non-food) inflation numbers do not yet seem to reflect ground reality, and we would not be surprised to see the July reading revised up. We expect deficient-monsoon induced supply shocks and higher global food prices to push primary (food and non-food) inflation higher in the coming months. This, along with an impending fuel price hike, oil prices already above USD110/bbl and a delayed adjustment to electricity prices, suggests that today's sub-7% reading is unlikely the start of a trend.
It is also important to highlight that today's positive surprise was largely due to lower inflation in the volatile vegetable category and lower fuel prices, which should soon reverse. Worryingly, the demand-side measure of inflation has inched sharply higher, despite weak growth. Therefore, we remain comfortable with our view that headline WPI inflation will rise above 8% by the end of the year, and we do not see today's positive WPI reading as a reason for the RBI to cut rates.
Aditi Nayar, Economist, ICRA
The easing in food inflation benefitted from a partial reversal in the uptrend in vegetable prices recorded in February-April 2012. However, the rise in the price level in month-on-month (m-o-m) terms for pulses and cereals reflects the below-normal sowing on the back of a rainfall deficit and rising minimum support prices. Additionally, the 1.6% m-o-m rise in non-vegetarian protein items and milk likely reflects the lower availability of fodder in parts of the country.
Leif Lybecker Eskesen, Chief Economist for India & ASEAN, HSBC
RBI is not likely to take comfort from this reading, especially considering the rise in core inflation. Moreover, the deficient monsoons pose upside risks to inflation, and RBI's room to maneuver also depends on the progress on fiscal consolidation and structural reforms.
Today's inflation reading was a positive surprise, but it is premature to claim that the inflation beast has been tamed. It may be more accurate to say that it has been slightly sedated, but only temporarily.
Base effects were clearly at play again. In July of last year a number of key administered fuel items, including high speed diesel and kerosene, were jacked up, and this lowered the annual inflation reading for July this year. When this base effect washes out over the next few months, fuel inflation will crawl up again. What's more, the government needs to raise diesel and kerosene prices to contain the subsidy bill, which will add to fuel inflation in coming months.
While food inflation eased a bit, it partly reflects a base effect for vegetables. Annual inflation ticked up for most other food categories, and food inflation remains firm in sequential terms. What's more, the below-normal (16%) rains during the summer monsoons pose upside risks to food inflation. If the rain short fall averages 10% for the full fiscal year, it could add around 0.8 percentage points to average WPI headline inflation for year.
Rising fuel and food prices could, in turn, spill over to inflation expectations, which would have broader implications for inflation and lift core inflation. It is also worth keeping in mind that there is little if any slack in the economy as potential output has declined on the back of slow progress on supply-side reforms. This will keep core inflation pressures simmering as supply struggles to keep pace with demand despite the slowdown in growth.
What this means is that the RBI should not take comfort in today's inflation surprise. It was driven by base effects, and the key thing to focus on is the rise in core inflation and the upside risks to inflation going ahead. The RBI would also like to relatively soon see decisive steps on fiscal consolidation and structural reform implementation before considering any further rate cuts.
Headline inflation eased more than expected in July, but this reflected base effects. Moreover, core inflation rose. Given lingering upside risks to inflation and, so far, slow progress on the fiscal and structural policy side, the RBI is likely to remain cautious about cutting rates.
Abheek Barua, Chief Economist, HDFC Bank
Inflation for the month of July released earlier today surprised sharply to the downside printing in at 6.87% against market expectations of 7.37% and an inflation reading of 7.25% a month ago. However, as pretty as the headline reading for June may be, its internals are not exactly comforting. The decline in inflation has largely come from a fall in deregulated fuel prices which is unlikely to sustain amidst a reversal in global oil prices. Further, after remaining below 5.0%, core inflation has ticked up to 5.5%. Besides, a number of upside risks remain from firm food prices and the possibility of a revision in diesel and electricity prices.
On balance however, today's inflation release means that headline inflation could now hover in the range of 7.0-7.5% for the remainder of FY13 against previous expectations of 7.5-8.0%. Along with the fact that Q1FY13 GDP data due by the end of the month could be disturbing, we believe that the chances of a repo rate cut by the RBI (if not by the next review on 17 September 2012 then in the next three months) have certainly increased. That said, for the RBI to actually act the government will have to play ball and spell out concrete steps to rein in the fisc.
Indranil Pan, Chief Economist, Kotak Mahindra Bank
The sub-7% zone on the headline WPI inflation does rake up expectations of monetary policy easing by the RBI sooner than later. This was also indicated by the G-sec market where the yield on the benchmark 10-year paper (8.15%GS2022) came off to an intra-day low of 8.12% after the data release from an intra-day high of 8.24% before the release. However, we prefer to hold on to our call for a pause on September 17. Conditions that could lead to inflationary pressures have worsened in August compared to July, with currency continuing to remain weak, India oil basket price higher by around 7-8%, CRB commodity index up by 2% and likely higher food inflation with weak domestic agriculture and a rise in global food prices. For India, pass-through of food prices onto generalized inflation is higher due to the inbuilt wage-price spiral.
A recent speech by Dr Subbarao (August 13) continues to remain hawkish on inflation, despite calls of "cautious risk" on the interest rate front from the Finance Minister. Dr Subbarao points out that inflation is high and stubborn and high current account gap still indicates demand pressures. Notably, the initial trade data release indicated a widening back of the trade deficit to US$15.5 bn in July from US$10.3 bn in June.
Rohini Malkani, Economist, Citi India
While the base effect will likely result in inflation trends remaining benign in the coming months, we maintain our view of inflation averaging 8% in FY13 as (1) Food prices could come under pressure due to weak trends in crop sowing (down 10%) and (2) Moves to lower 'suppressed inflation' – a partial fuel hike would increase the WPI by ~60bps (page 3). Nonetheless, despite inflation likely to remain well above the RBI's medium-term target of 4%-5%, we are holding on to our 50bps rate cut call in FY13 due to the deceleration in growth (as seen in factory output, auto sales, exports).
Richard Iley, Chief Asia Economist, BNP Paribas
WPI inflation showed an unexpected and welcome pullback in July, slipping below 7%. But the data were not as benign as first blush would suggest. The lagged impact on June's sharp fall in oil prices, which has since partially reversed, was the key driver. Core factory gate inflation, despite a stagnant industrial sector, showed a worrying pick up that will not escape the RBI. And, with the poor monsoon likely to ensure that food inflation re-accelerates smartly in the balance of the year, today's better than expected data are simply a temporary lull in inflationary pressure. The RBI's wiggle room to bring down policy rates remains limited.
Sujan Hajra, Chief Economist, Anand Rathi Financial Services
With monsoon rainfall by 13 Aug'12 falling 15% below normal, the kharif harvest is likely to see a dip this season. This would further push up food prices, particularly of pulses, oilseeds, vegetables and animal fodder. Besides, incorporating the electricity tariff hikes in many states into the WPI as well as the much-needed diesel price hike, when applied, is likely to push up inflation. We see two scenarios unfolding in FY13. If, monsoon rainfall picks up from this point, we estimate food inflation to peak at 14% and overall WPI inflation at 8.5% by Dec'12. If, monsoon rainfall does not pick up, we expect food inflation to peak at 18% and WPI inflation to cross 10% by Dec'12.
Despite inflation slipping below 7% and despite growth weakening, we maintain our call of "no repo cut till Dec'12" due to the mounting upside risks regarding inflation. Rather, we expect the RBI to focus on liquidity-easing measures in FY13 through open-market operations (`2.6trn) and by slashing the CRR (by up to 100bps).
Outlook
WPI based inflation has eased contrary to market expectations. But with rainfall during South West Monsoons 2012 sofar remaining below normal, Also, despite sharp increase in under recoveries for Oil Marketing Companies (OMCs), they have not been allowed to increase diesel, domestic LPG and Kerosene prices, leading to heavy losses for OMCs in the quarter ended June 2012. Unless the crude oil prices come down substantially or the government allows fuel prices to go up, the pain on the economy either through higher fiscal deficits / fuel subsidies or through deterioration in the financial position of OMCs will be severe. So, sooner the fuel prices needs to be hiked, which can lead to both, direct and indirect adverse impact on WPI based inflation. So, RBI may not rush to cut rates any time sooner. Rather the increase in core inflation needs to be monitored, besides the fact that pent up rise in fuel prices needs to be passed on. 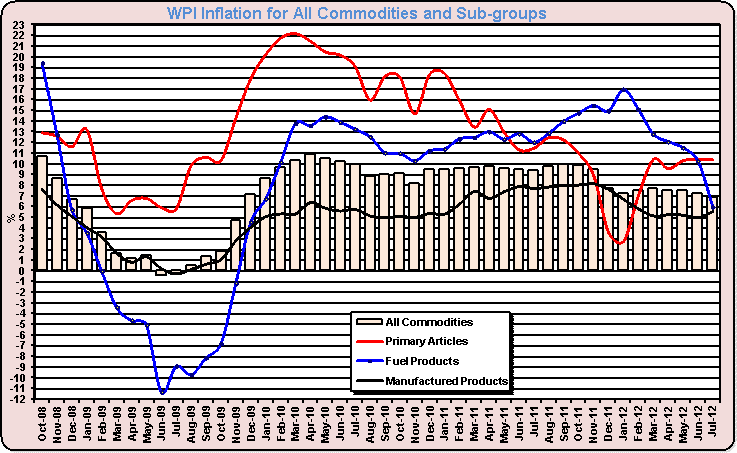
|