|
India' WPI inflation rebounded from 31 months low of 6.87% in July 2012 to 7.55% in August 2012. The sharp increase in inflation was caused by rebound in inflation for fuel and power group 8.32% in August 2012 from 6.0% in July 2012. The inflation for manufactured products also increased to 6.1% in August 2012 from 5.58% in July 2012, showing acceleration for the third straight months. Meanwhile, the inflation for primary articles eased 10.1% in August 2012 from 10.4% in July 2012.
The increase in inflation for food grains, oilseeds, electricity, manufactured food products and textiles item weighed up on overall inflation for August 2012. Meanwhile, the inflation for vegetables, milk, ‘egg, meat & fish' and basic metal products ease during August 2012 from July 2012, restricting further rise in overall inflation during August 2012.
The increase in inflation was sharply above the market expectations of increase expected to 7.0% for August 2012. As per the poll of Capital Market, economists had expected inflation to increase to 7.0% in August 2012 from 6.9% in July 2012. Economists polled had forecasted the inflation in the range of 7.1% to 7.2% for July 2012. The median of the economists forecast's for inflation of July 2012 stood at 7.4%, while the average was lower at 7.3%.
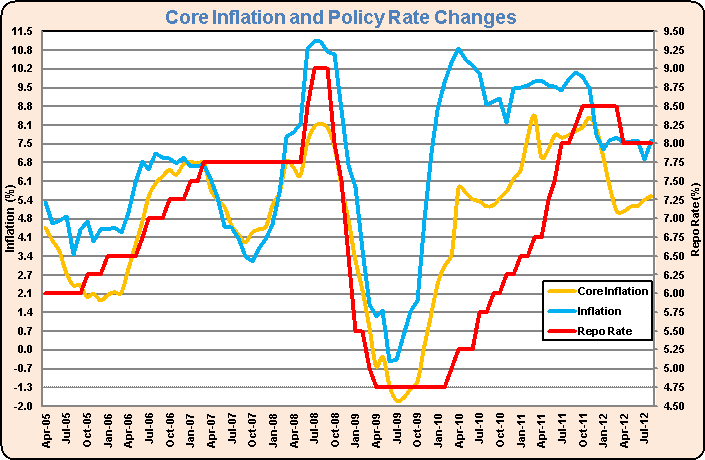
The inflation for food item (food articles and food products) increased from 8.72% in July to 9.09% in August 2012, which has jumped from mere 1.5% in January 2012. Meanwhile, the inflation for non-food items (all commodities excluding food items) also advanced from 6.20% in July 2012 to 6.92% in August 2012. The core inflation (manufactured products excluding foods products) accelerated from 5.45% in July 2012 to 5.58% in August 2012.
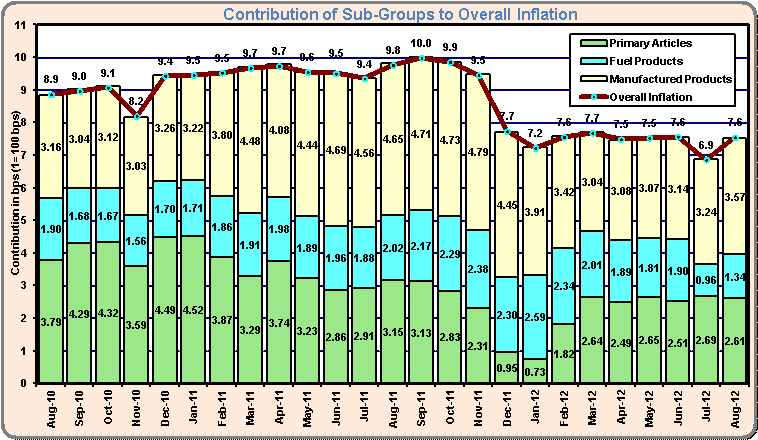
The contribution of primary articles to the overall inflation dipped to 34.7% (at 261 bps to 7.55% inflation) in August 2012 from 39.0% (at 269 bps of 6.87%) in July 2012. The contribution of fuel product group surged to 17.8% (134 bps) in August 2012 from 13.9% (96 bps), while that of manufactured products also increased 0.4% to 47.4% (357 bps) in August 2012. The contribution of food item (food articles and food products) declined to 33.5% (251 bps) in August 2012 from 35% (241 bps) in July 2012, while that of non-food items (all commodities excluding food items) increased to 66.7% (501 bps) in August 2012 form 65.1% (449 bps) in July 2012.
June 2012 inflation figure revised upwards
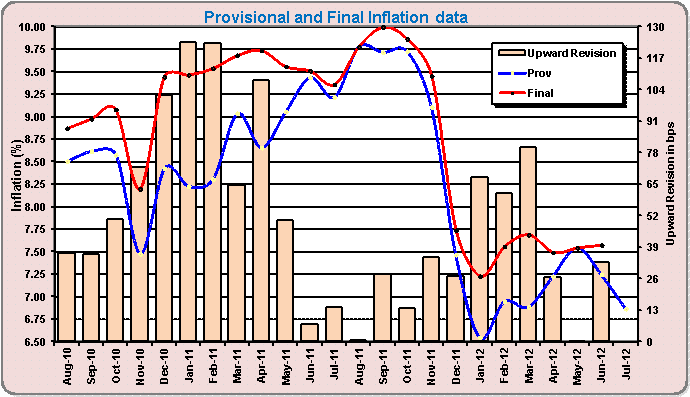
The inflation figure for June 2012 was revised sharply upward to 7.58% from 7.25% reported earlier, as the inflation for fuel and power group as well as manufactured products was scaled up to 12.1% and 5.37%, respectively, compared to 10.27% and 5.0% reported earlier. Meanwhile, the inflation figure for primary articles was revised downwards to 9.75% from 10.46% report earlier.
July 2012 inflation will be revised upward by at least 35 bps
The inflation figure for June 2012 was revised upward mainly due sharp upward revision of inflation for electricity to 17.7% from mere 4.0% reported earlier. The provisional data for July 2012 is scheduled for revision in next the months along with September 2012 WPI figures.
The provisional electricity inflation for August 2012 was higher at 17.7% compared to provisional electricity inflation figure of 4.0% for July 2012. Thus, after June 2012 electricity inflation sharply revised upward to 17.7% the July 2012 electricity inflation will surely be scaled up to 17.7%, contributing 35 bps to increase in overall inflation.
Thus, the provisional inflation figure for July 2012 at 6.87% will be at least revised upward to 7.23%.
Diesel price hike to contribute 70 bps directly to inflation during September-October
Government has announced the hike in diesel price by Rs 5 per liter effective from 14 September 2012. However, there was no change in prices of petrol and PDS kerosene.
Diesel carries the large 4.67% weight in the wholesale price index and diesel price movement cause movement in WPI inflation with ripple effect on various other commodity prices.
Government has announced approximately 13.6% increase in diesel price, which will add 70 bps directly to the headline inflation during September-October 2012. The additional contribution to inflation will be spread over September-October 2012, as the diesel price hike has been announced in the third week of the September 2012.
Further, with the ripple effects of increase in diesel price on various other commodity prices though increase in transportation costs and others, the direct and indirect impact together can be approximately 100 bps. However, the ripple effects of diesel price hike also depends on whether higher transportation and other costs are passed on through higher prices, whose scope is limited in weak economic conditions.
Inflation for Sub-Groups
Primary Articles
The decline in the inflation for primary articles was mainly driven by food articles inflation easing from 10.06% in July 2012 to 9.14% in August 2012, but inflation for non-food articles increased to 13.75% in August 2012 from 13.05% in July 2012. However, the inflation for minerals also increased to 9.74% in August 2012 from 8.43% in July 2012.
Within food articles group, under primary articles group, the inflation for vegetables plunged to 10.0% in August from 24.11% in July 2012, while the inflation for fish-inland and poultry chicken slumped to 16.9% and 10.1% in August 2012. Further, the inflation for milk also declined to 6.7% in August 2012. On the other hand, the inflation for food grains surged 15.1% in August 2012. The inflation for fruits further increased to positive zone of 1.1%, while that for turmeric increased to (-) 20.7% from 38.7% in July 2012. The inflation for fish-marine, tea and coffee also increased to 16.9%, 32.8% and 0.6% in August 2012.
Within the vegetables, the inflation for cabbage and okra dipped to 4.0% and (-) 11.4%, while that for onion and tapioca also declined to (-) 20.7% and (-) 32.6% in August 2012. However, the inflation for tomato surged to 52.8% in August 2012. Among the fruits, inflation for papaya, lemon and guava increased, while that for mango, pineapple and cashew nut declined. Among the food grains, the inflation for rice, wheat, gram, urad and arhar increased to 10.3%, 12.9%, 64.5%, 1.1% and 21.5% during August 2012.
The inflation for non-food articles, in primary articles group, increased 13.75% in August 2012 to 13.05% in July 2012, driven down by surge in inflation for oilseeds to 28.3% in August from 25.2% in July 2012. The inflation for sugarcane and fodder also increased to 4.9% and 15.3% in August 2012. However, the inflation for flowers declined to (-) 8.7% from (-) 3.8% in July 2012, while the inflation for raw cotton dipped to 0.4% in August from 4.7% in July 2012.
The inflation for minerals group, under primary articles group, increased 9.74% in August 2012 from 8.43% in July 2012 driven up by increase in inflation for iron ore to 14.8% in August 2012, while the inflation for copper ore also increased to 10.9% in August 2012. Within the minerals group, the inflation for crude petroleum declined to 6.6% in August 2012 to 7.6% in July 2012.
Fuel and Power
The inflation for fuel and power group rebounded to 8.3% in August 2012 from 5.98% in July 2012. Within the group, the inflation for coal was steady at 13.9%, but that for electricity surged to 17.7% in August from 4.0% in July 2012. Meanwhile, the inflation for mineral oil increased from 4.53% in July to 4.97% in August 2012. Among the mineral oils, the inflation for high speed diesel, ATF, kerosene, petrol, naphtha and light diesel oil increased, while that for furnace oil, lubricant and bitumen decline during August 2012.
Manufactured Products
Within Manufactured group, the inflation for food products surged to 9.0% in August 2012, while that for textiles and chemical products also increased to 3.0% and 7.7% in August 2012. Further, the inflation for non-metallic mineral products and rubber & plastic products also rose to 9.8% and 2.5% in August 2012. However, the inflation for base metals and beverages & tobacco products eased to 8.11% and 4.8% in August 2012.
| Index Numbers of Wholesale Prices (Base 2004-05=100) |
|
Weight (%) |
Inflation |
Contribution to Inflation |
| Aug-11 |
Aug-12 |
April-Aug |
Aug-11 |
Aug-12 |
April-Aug |
| 2011-12 |
2012-13 |
2011-12 |
2012-13 |
| All Commodities |
100 |
9.78 |
7.55 |
9.59 |
7.41 |
9.78 |
7.55 |
9.59 |
7.41 |
| I Primary Articles |
20.12 |
12.46 |
10.08 |
12.63 |
10.02 |
3.15 |
2.61 |
3.18 |
2.59 |
| (A) Food Articles |
14.34 |
9.62 |
9.14 |
8.86 |
10.32 |
1.73 |
1.64 |
1.58 |
1.83 |
| (B) Non-Food Articles |
4.26 |
18.21 |
13.75 |
20.13 |
8.68 |
0.84 |
0.69 |
0.93 |
0.44 |
| (C) Minerals |
1.52 |
21.54 |
9.74 |
24.75 |
10.62 |
0.58 |
0.29 |
0.66 |
0.32 |
| II Fuel & Power |
14.91 |
12.91 |
8.32 |
12.63 |
9.96 |
2.02 |
1.34 |
1.95 |
1.58 |
| (A) Coal |
2.09 |
13.25 |
13.92 |
13.25 |
13.92 |
0.32 |
0.35 |
0.32 |
0.35 |
| (B) Mineral Oils |
9.36 |
16.54 |
4.97 |
16.01 |
9.14 |
1.73 |
0.55 |
1.63 |
0.99 |
| (C) Electricity |
3.45 |
-1.32 |
17.69 |
-0.37 |
9.48 |
-0.04 |
0.44 |
-0.01 |
0.24 |
| III Manufactured Products |
64.97 |
7.87 |
6.14 |
7.55 |
5.52 |
4.65 |
3.57 |
4.49 |
3.22 |
| (A) Food Products |
9.97 |
8.41 |
9.01 |
7.82 |
6.68 |
0.83 |
0.88 |
0.77 |
0.65 |
| (B) Beverages & Tobacco Products |
1.76 |
13.51 |
4.76 |
11.23 |
6.82 |
0.24 |
0.09 |
0.20 |
0.13 |
| (C ) Textiles |
7.33 |
9.04 |
3.00 |
13.55 |
-0.93 |
0.55 |
0.18 |
0.82 |
-0.06 |
| (D) Wood & Wood Products |
0.59 |
8.64 |
5.41 |
7.17 |
5.96 |
0.05 |
0.03 |
0.04 |
0.04 |
| (E) Paper & Paper Products |
2.03 |
4.86 |
2.66 |
6.74 |
2.34 |
0.09 |
0.05 |
0.12 |
0.04 |
| (F) Leather & Leather Products |
0.84 |
0.62 |
3.55 |
0.42 |
3.51 |
0.00 |
0.02 |
0.00 |
0.02 |
| (G) Rubber & Plastic Products |
2.99 |
7.92 |
2.47 |
8.27 |
2.01 |
0.21 |
0.06 |
0.22 |
0.05 |
| (H) Chemicals & Chemical Products |
12.02 |
8.48 |
7.67 |
7.90 |
7.33 |
0.89 |
0.79 |
0.83 |
0.76 |
| (I ) Non-Metallic Mineral Products |
2.56 |
3.89 |
9.76 |
3.83 |
7.85 |
0.10 |
0.24 |
0.10 |
0.20 |
| (J) Basic Metals, Alloys & Metal Products |
10.75 |
12.07 |
8.11 |
9.61 |
9.91 |
1.26 |
0.87 |
1.02 |
1.05 |
| (K) Machinery & Machine Tools |
8.93 |
3.15 |
2.81 |
3.02 |
2.66 |
0.24 |
0.20 |
0.23 |
0.19 |
| (L) Transport, Equipment & Parts |
5.21 |
4.44 |
3.77 |
2.82 |
3.74 |
0.20 |
0.16 |
0.13 |
0.16 |
| Non-Food Manufactured |
55 |
7.78 |
5.58 |
7.50 |
5.30 |
3.83 |
2.70 |
3.72 |
2.58 |
| Food Articles + Food Products |
24.31 |
9.19 |
9.09 |
8.49 |
9.03 |
2.55 |
2.51 |
2.35 |
2.48 |
| Non-Food Inflation |
75.69 |
10.07 |
6.92 |
10.04 |
6.77 |
7.27 |
5.01 |
7.26 |
4.92 |
| Source: Ministry of Commerce and Industry |
Contribution to inflation
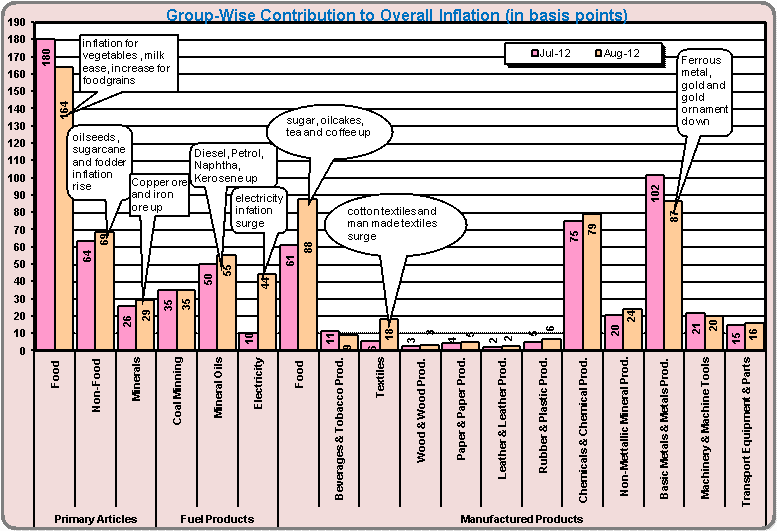
During August 2012, WPI based inflation rate stood at 7.55%, of that 34.7% came from primary articles, followed by 47.4% from the manufactured products group and 17.8% from fuel products group. WPI based inflation for August 2012 was 68 bps higher compared to 6.87% reading in July 2012.
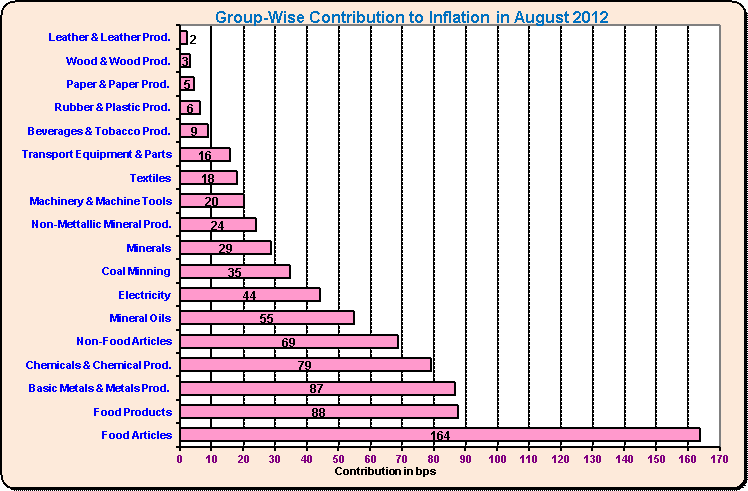
Within the primary articles, the contribution of food articles to overall inflation declined to 164 bps in August 2012 from 180 bps during July 2012. Within the food articles, the contribution of food grains, turmeric, tea and coffee increased, while that of vegetables, milk, fish-inland and poultry chicken declined during August 2012. The contribution of non-food articles increased to 69 bps in August 2012 from 64 bps in July 2012. Among the non-food articles, the contribution of raw oilseeds, sugarcane and fodders increased, while that of raw cotton and flowers eased during August 2012. The contribution of mineral group increased rose to 29 bps in August 2012 to 26 bps in July 2012, due to increase in inflation for copper ore and iron ore during August 2012.
The contribution of fuel and power group surged from 96 bps in July 2012 to 134 bps during August 2012. Within the fuel products group, the contribution of mineral oils rose to 55 bps from 50 bps in July 2012, while that of electricity surged to 44 bps from 10 bps in July 2012. Meanwhile, the contribution of coal was steady at 35 bps during August 2012. Within the mineral oils group, the contribution of naphtha, high speed diesel, kerosene, ATF and petrol rose during August 2012.
The contribution of manufactured products to overall inflation increased from 324 bps in July to 357 bps August 2012. Within manufactured products, the contribution of ‘food products' galloped 27 basis points, while that of textiles and chemical products also increased 12 bps and 04 bps. The contribution of non-metallic mineral products also rose 04 bps. On the other hand, the contribution of base metals and beverage & tobacco products declined 15 bps and 02 bps in August 2012.
As per the commodity wise look-up, the contribution of Electricity (Agricultural) surged 17 bps, while that of sugar and tomato increased 16 bps each during August 2012 from July 2012 level. The share of Electricity (Industry) rose 10 bps, while that of wheat and Electricity (domestic) moved up 06 bps each in August 2012. The contribution of papaya and cotton yarn (unbleached) increased 05 bps each, while that of Turmeric, Naphtha, Fish-Marine, Grey Cement and Iron Ore increased 03 bps each. Further contribution of Gingelly Seed (Sesamum), Di Ammonium Phosphate, Gram, Arhar, Tea Leaf (Unblended), Wheat Flour (Atta), Vanaspati, Polyester Yarn, High Speed Diesel, Soyabean, Tea Leaf (Blended), Rape & Mustard Seed and Sugarcane in August 2012.
On the other hand, the contribution of cabbage dipped by 21 bps, while that of fish-inland gold & ornaments declined 10 bps and 08 bps, respectively. The share of milk declined 06 bps, while that of okra, raw cotton and onion declined 04 bps each. The contribution of mango fell 03 bps, while that of pencil ingots, sponge iron, crude petroleum and poultry chicken eased 02 bps each. Further the contribution of furnace oil, pineapple, tapioca, pig iron, lubricants, other alloys, urea, polymers, chewing tobacco, jasmine, bitumen, cashew kernel, cigarette, dye & dye intermediates and mustard & rapeseed oil declined 01 basis point each in August 2012.
Out of the 676 commodities, about 309 commodities, which carry 52.8% weight in the WPI, has recorded acceleration in inflation rate during August 2012 compared with July 2012 inflation rate. About 230 commodities that hold 38.99% weight in the WPI have witnessed deceleration in inflation rate during August 2012. However, the inflation for 137 commodities, carrying 8.2% weight in WPI, has remained unchanged during August 2012.
WPI Inflation (M-o-M Basis)
Primary Articles (Weight 20.12%)
The index for primary articles group rose 0.3% during August 2012 from July 2012 level. Within the group, the index for `Food Articles` group declined 0.4% due to lower prices of fruits & vegetables (5%), poultry chicken (4%), fish-marine (2%) and milk (1%). However, the prices of arhar (8%), ragi (7%), gram and urad (6% each), moong, coffee and wheat (5% each), bajra, condiments & spices and masur (4% each), egg, tea and fish-inland (3% each), jowar, maize and rice (2 % each) and mutton and barley (1% each) moved up.
The index for 'Non-Food Articles' group rose by 3.8% due to higher prices of castor seed (15%), raw silk (14%), gingelly seed (12%), coir fibre (11%), rape & mustard seed (9%), cotton seed and linseed (7% each), niger seed and flowers (6%), soyabean (5%), fodder, groundnut seed and sugarcane (4% each), guar seed, logs & timber and raw cotton (3% each), raw jute (2%) and sunflower (1%). However, the prices of raw rubber (6%), copra (coconut) and mesta (2% each) declined.
The index for 'Minerals' group declined 1.3% due to lower prices of sillimanite (13%), copper ore (9%), magnesite (7%), zinc concentrate and crude petroleum (3% each), steatite (2%) and chromite (1%). However, the prices of phosphorite (23%), iron ore (4 %) and barytes (1%) moved up.
Fuel & Power (Weight 14.91%)
The index for this major group increased 3.1% due to higher prices of electricity (agricultural) (23%), electricity (industry) (11%), electricity (domestic) (9 %), electricity (railway traction) (8%), light diesel oil (7%), electricity (commercial) and naphtha (6%each), aviation turbine fuel (5%), furnace oil (4%), kerosene (2%) and petrol (1%).
Manufactured Products (Weight 64.97%)
The index for manufactured products group increased 0.8% during August 2012 from the previous month level. Within the manufactured products group, the index for ‘Food Products' group rose by 3.0% due to higher prices of sugar (8%), oil cakes and gur (6% each), gram powder (besan), sooji (rawa) and gingelly oil (5% each), wheat flour (atta), khandsari and cotton seed oil (4% each), tea dust (unblended) and maida (3% each), mustard & rapeseed oil, vanaspati and mixed spices (2% each) and gola (cattle feed), groundnut oil, soyabean oil, bakery products, processed prawn and ghee (1% each). However, the prices of tea leaf (unblended) (1%) declined.
The index for `Textiles` group rose 0.2% due to higher prices of man made fibre, jute yarn and cotton fabric (1% each).
The index for `Wood & Wood Products` group rose by 0.3% due to higher prices of processed wood (1%).
The index for `Paper & Paper Products` group rose by 0.5% due to higher prices of paper cartons / boxes (6%), newspaper (2%) and paper rolls (1%). However, the prices of computer stationery (2%) and newsprint (1%) declined.
The index for `Leather & Leather Products` group rose by 0.4% due to higher prices of leathers (1%).
The index for `Rubber & Plastic Products` group rose by 0.7% due to higher prices of plastic products and rubber products (1% each).
The index for `Chemicals & Chemical Products` group rose by 0.6% due to higher prices of di ammonium phosphate (3%), pigment & pigment intermediates and organic manure (2% each) and synthetic resin, paints, non-cyclic compound, basic organic chemicals, adhesive & gum, ammonium sulphate, basic inorganic chemicals, safety matches/ match box and antibiotics (1% each). However, the prices of rubber chemicals and distemper (2% each) and polymers (1%) declined.
The index for `Non-Metallic Mineral Products` group rose by 1.1% due to higher prices of railway sleeper (3%), grey cement (2%) and white cement and polished granite (1% each). However, the prices of glass bottles & bottleware (1%) declined.
The index for `Basic Metals, Alloys & Metal Products` group rose by 0.1% due to higher prices of gold & gold ornaments (3%), ferro chrome (2%) and nuts/bolts/screw/ washers, steel: pipes & tubes, ferro manganese, zinc and aluminium (1% each). However, the prices of sponge iron (3%), pencil ingots (2%) and wire rods, melting scrap, gp/gc sheets, pig iron, copper products (other than wire) and rounds (1% each) declined.
The index for `Machinery & Machine Tools` group rose by 0.2% due to higher prices of conductor (6%), lamps, fans and material handling equipments (3% each), harvester, ups / stabilizer, fibre optic cable and electric switches (2% each) and insulators, electrical wires, electric switch gears, air conditioner & refrigerators, capacitors, thresher and plastic machinery (1 % each).
The index for `Transport, Equipment & Parts` group rose by 0.6% due to higher prices of auto rickshaw / tempo / matador (3%), tractors (2%) and parts of ships/boats etc., bus / mini bus / truck and motor cycle / scooter / moped (1% each).
Expert Views
Sonal Varma, India Economist, Nomura Financial Advisory Services
We expect primary inflation to remain under pressure in the coming months due to the recent surge in global commodity prices and higher food prices. In fact, the Reuters Jefferies CRB index in INR terms is currently at a four-year high, which suggests that input cost pressures are rapidly building. We expect headline WPI inflation to rise above 8% by end-2012, and hence do not see any scope for the RBI to cut rates until the end of 2012.
Aditi Nayar, Economist, ICRA
Higher-than-expected headline inflation of 7.55% for August 2012, similar to the trend in April-June 2012, as well as the pickup in core inflation confirms our expectation that the Central Bank will maintain the policy rate and the CRR in the mid-quarter policy review. Food inflation eased in August 2012 relative to the double-digit inflation in the previous five months, on the back of a continued correction in vegetable prices. However, a number of agricultural commodities such as cereals, pulses, fibres, sugar, oilseeds and edible oil displayed a month-on-month increase in prices, partly reflecting the monsoon-related concerns that prevailed in August. While such concerns have abated to an extent in recent weeks, the first and second round impact of the diesel price hike is expected to push WPI inflation above 8% in October 2012.
Leif Lybecker Eskesen, Chief Economist for India & ASEAN, HSBC
WPI inflation rose to 7.6% y-o-y in August (vs. 6.9% in July and consensus of 7.1%) on the back of higher fuel, power, and core inflation. Looking ahead, higher food and fuel prices are likely to lift inflation. While the government yesterday finally decided to hike diesel and LPG prices and this will add to inflation, it was a welcome step. The hike in fuel prices will contain fiscal slippage this year, but it will not prevent it. RBI will be encouraged by the fuel price hike, but the lingering inflation risks will keep it on hold on Monday.
Emkay Global Financial Services
WPI inflation at 7.55% for Aug'12 exhibited price pressures in all three key indices. The data indicated a sharp spike in food products and revision on the long due electricity prices. In addition to the rising headline number, core inflation too witnessed a rise. Overall inflation would continue to remain high in light of higher input prices and announced hike in diesel price. Core inflation is broadly tracked by the RBI in policy making decisions. We believe RBI is unlikely to announce a rate cut on 17 September 2012.
CRISIL
WPI-based inflation rose to 7.6 per cent in August after having fallen to 6.9 per cent in July. The resurgence in inflation was largely due to a revision in electricity prices. Electricity price revision raised administered fuel inflation to 7 per cent in August from 4 per cent a month earlier. Overall fuel Inflation, which rose to 8.3 per cent in August, is expected to rise further over September-October due to higher crude oil prices and the recently announced hike in diesel prices by Rs 5/litre.
The direct one-time impact of the revision in diesel prices on WPI inflation is expected to be around 60 basis points. As prices have been revised in mid-September, only a partial impact is likely to be seen next month while full impact will play out in October. The upward price revision of diesel as well as a move to reduce the subsidy burden on LPG paves the way for the Reserve Bank of India to cut the repo rate going ahead.
IDBI Bank
Apart from the August headline reading having come higher than expectations; more worrisome development was the considerable upside noted under the manufactured products sub-group. Moreover, with the recent stimulus measures announced by the advance economies, the bias for energy and commodity prices globally has moved to the upside. We therefore continue to see the RBI maintaining its policy stance in the near term. However, if fiscal consolidation measures, like the one on diesel price hike announced lately, were to continue; the central bank then would have some room to alter its stance and provide some rate easing by the end of this fiscal year.
Outlook
We expect WPI based inflation for July 2012 to be revised upwards, factoring in upward revision in WPI of electricity. Also, the hike in diesel prices would increase the WPI by 60 basis points directly, and the full impact can go upto 100 basis points. However, considering the sluggish economic conditions, players may not fully pass on the costs to customers, despite road freight rate hikes due to hardening of diesel prices. Also, the full impact of diesel price hike will get reflected only in October 2012 data, as September 2012 data will capture only partially, as the hike was effected in mid September 2012.
On the positive side, there is some moderation in the agri commodity prices recently, partly due to improving monsoons. Also, with slew of measures taken by the Government, and favourable global market conditions, Indian rupee is oflate recovering. This can lead to fall in the landed cost of imports, and force many players either to cut prices or to stop hiking prices. This will have a marginal favourable impact on inflation, especially on the industrial product side.
Despite inflation being higher than economist expectations and RBI's projected level, there appears to be strong pressure on RBI, if not to cut rates, to atleast cut Cash Reserve Ratio. It remains to be seen whether RBI succumbs to such pressure. 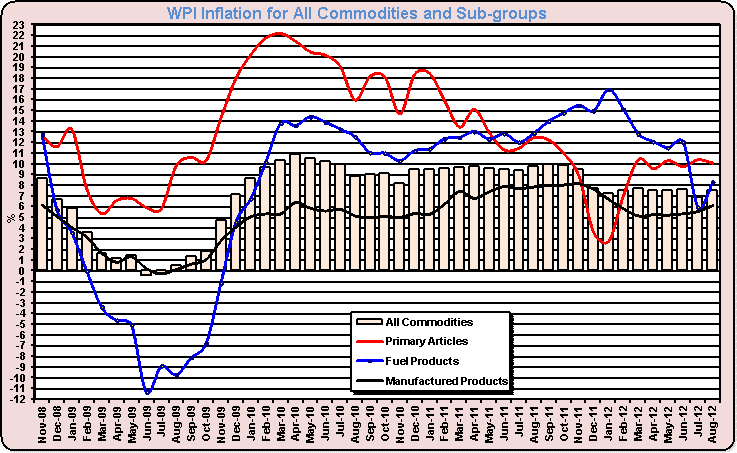
|